One day, I was challenged to create a “live” threat map from our existing SIEM data for display on our SOC wall screens.
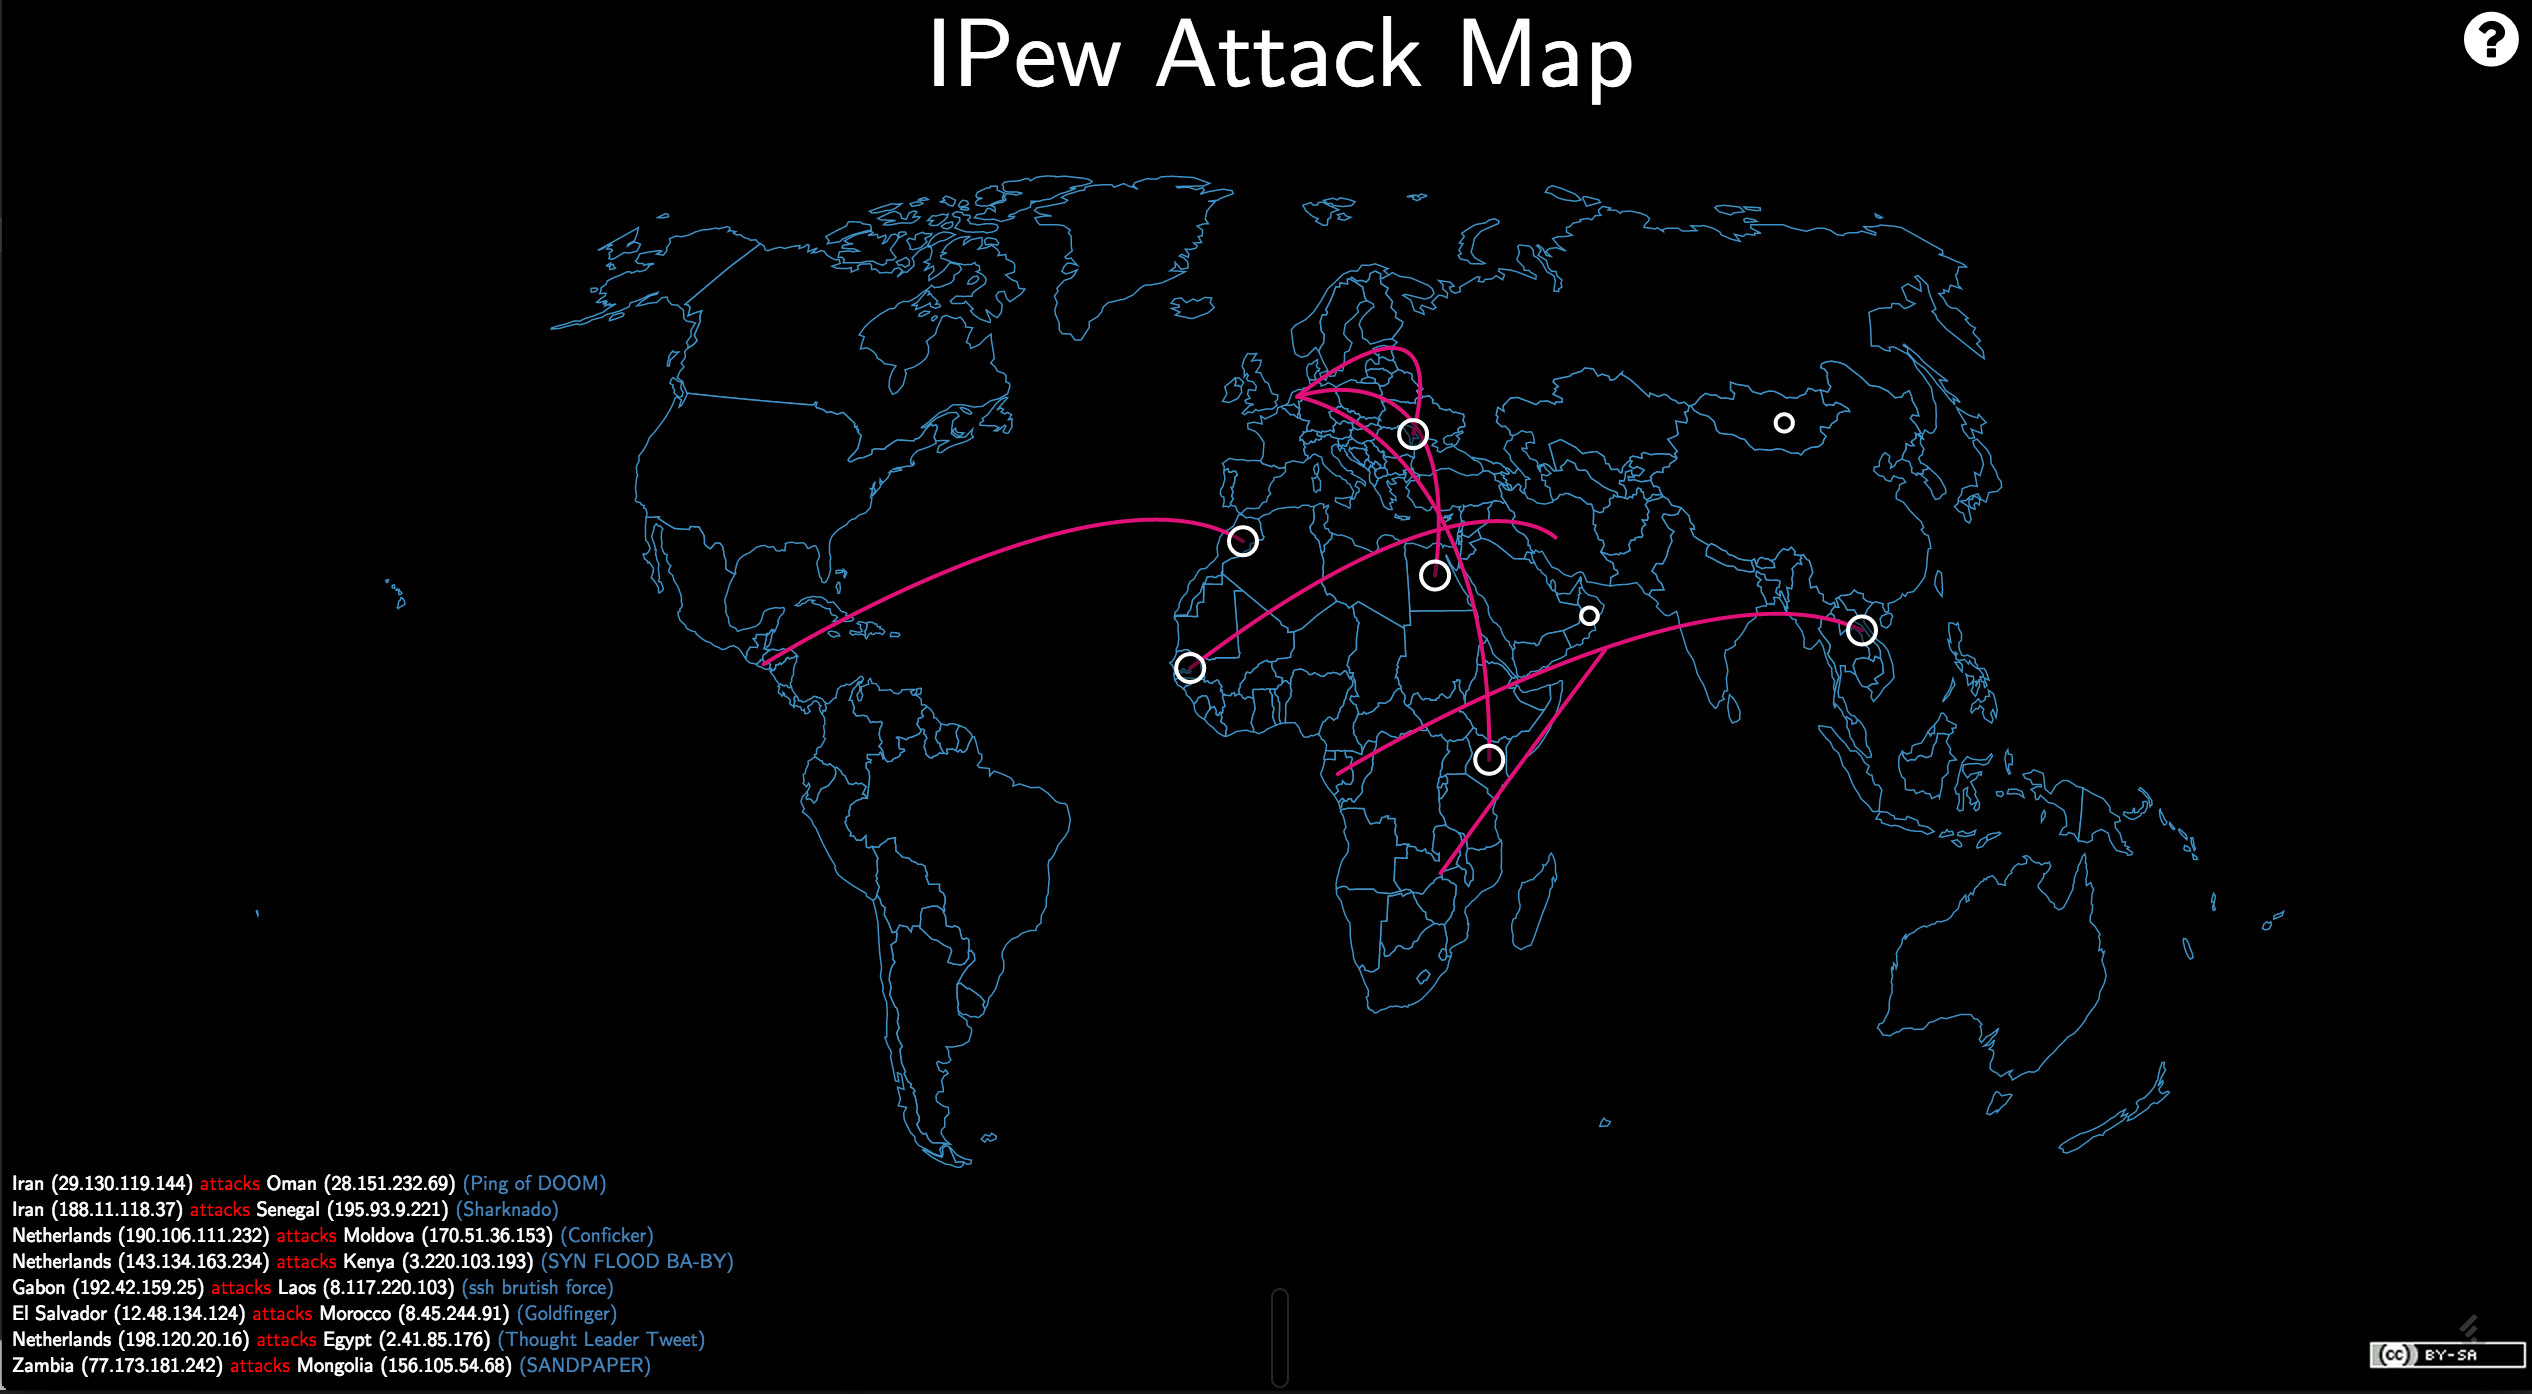
Never one to shrink from a challenge, I accepted. But I know practically no JavaScript, I’m not a web developer by any stretch of the imagination, and I had nowhere to start except this project, which is a joke threat map that plots random attacks using random geographical coordinates.
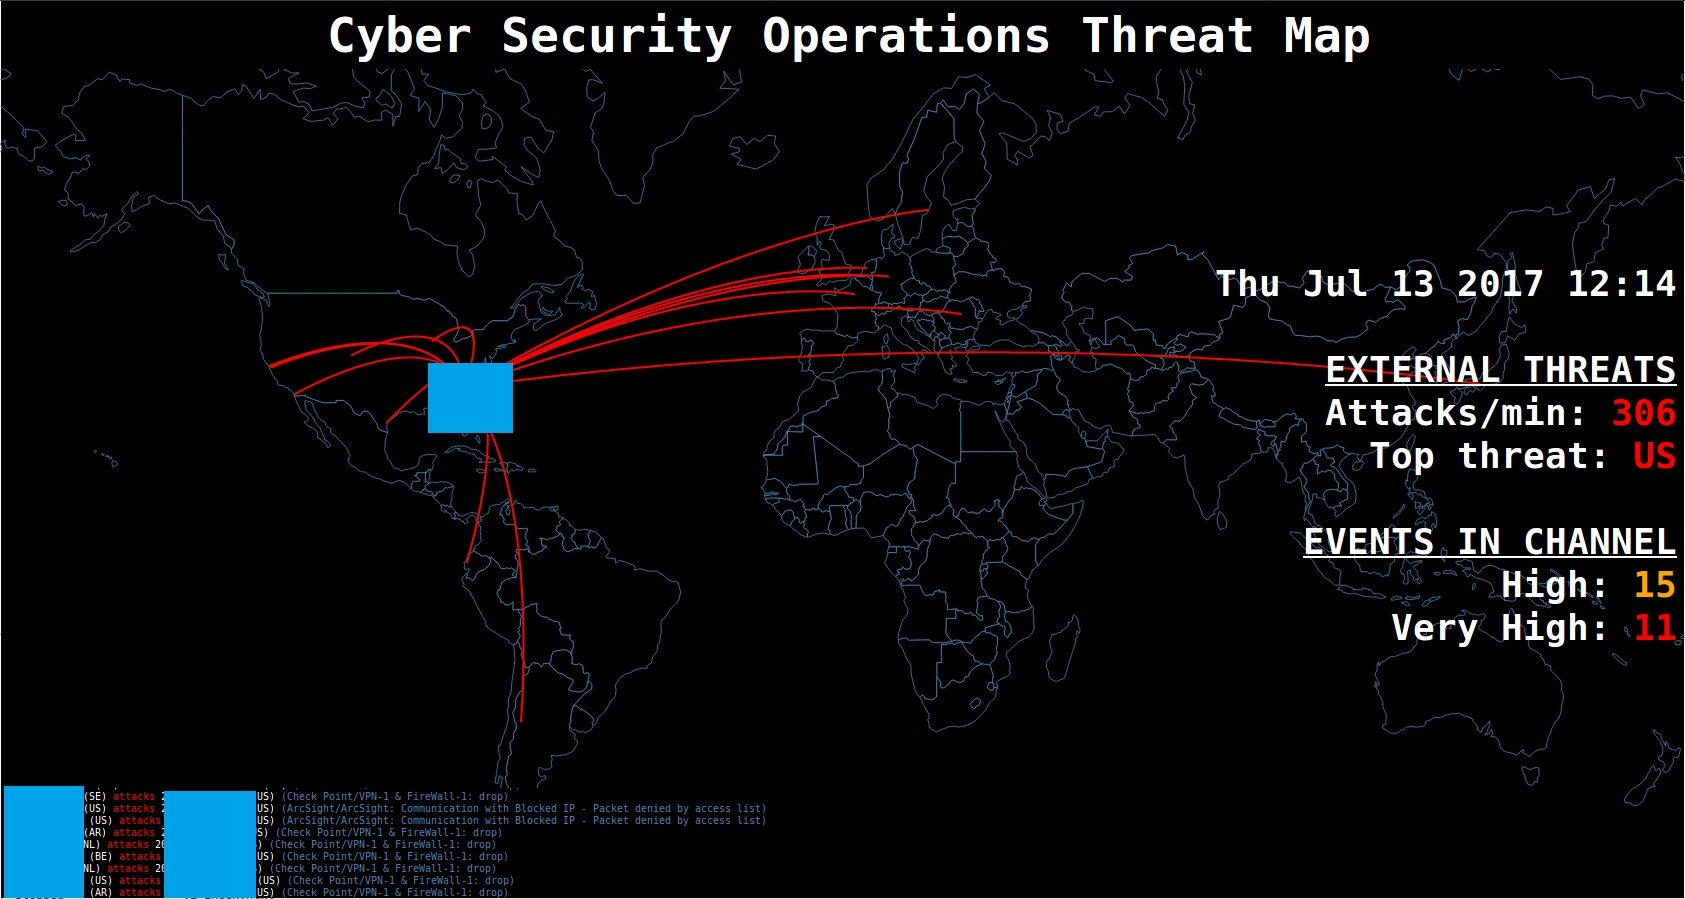
So how did I manage to create something like this…
from something like this?
First, get the data
The first thing I had to figure out was how to get the data out of our SIEM (ArcSight) and into a form I could work with in JavaScript. I accomplished this by learning enough from this tutorial and its second part to figure out the components I needed to get the data.
In short, I needed:
- An ArcSight filter that would grab the events I wanted to map from the perimeter controls,
- An ArcSight query that would use the filter and update every minute,
- The Resource ID for the query,
- A way to get my ArcSight API auth token for a session,
- Some code to automate grabbing and parsing the XML from the API for the query.
After writing the filter and creating the query, I made note of the Resource ID for the query in the Inspect/Edit pane under the General tab.
Then, I came up with the following code:
#!/usr/bin/env python

import requests
import xml.etree.cElementTree as ET
import itertools

from requests.packages.urllib3.exceptions import InsecureRequestWarning
requests.packages.urllib3.disable_warnings(InsecureRequestWarning)

proxies = {"http": "", "https": "", "ftp": ""}


# Get auth token
r = requests.get("https://SERVERNAME:8443/www/core-service/rest/LoginService/login?login=USERNAME&password=PASSWORD", verify=False, proxies=proxies)
authxml = r.text

root = ET.fromstring(authxml)
child = root[0]
authkey = child.text

r = requests.get("https://SERVERNAME:8443/www/manager-service/rest/QueryViewerService/getMatrixData?authToken=%s&id=RESOURCE_ID" % authkey, proxies=proxies, verify=False)

data = r.text

e = ET.XML(data)

a = e.iter()
for i in xrange(1,18):
  dummy = a.next().text

while True:
  try:
    dummy = a.next().text
    ts = a.next().text
    name = a.next().text
    msg = a.next().text
    dip = a.next().text
    sip = a.next().text
    prod = a.next().text
    vendor = a.next().text
    proto = a.next().text
    type = a.next().text
    print "%s,%s,%s,%s,%s,%s,%s,%s,%s" % (ts,name,msg,dip,sip,prod,vendor,proto,type)
  except:
    break
Massage the data
Now that I have the data from the SIEM, I need to grab the latitude and longitude for the IP addresses so they can be mapped. I accomplished this using pygeoip and MaxMind’s GeoLiteCity database.
This was relatively simple Python code that read the source and destination IPs from the results of
the above code, and spit out latitude and longitude for each IP.
I also grabbed the two-letter country code from the database.
I looked up the coordinates for my location and used them as a default in the event that
the database didn’t contain a mapping for an IP.
I did the same for any IP that mapped to 37.751, -97.822, which are false coordinates in the US, and sometimes used when there is no valid data for the IP.
I output a header containing all the field names, and then ran through all the data grabbed from the SIEM. I looked up the coordinates and country code for each IP, and enriched each line from the SIEM with this data, and sent all of this to a file.
Then, I moved that file into the root directory for the web page, ensuring that the freshest data is in place to be read.
Next, I set up a script to do this continuously, and had systemd start it automatically at boot, and ensure it’s restarted if it dies.
NOTE: You may be noticing at this point that there’s all sorts of issues with this approach, the largest being that I may not be able to guarantee that all the data gets plotted.
That’s absolutely fine.
Threat maps like this aren’t meant to be 100% accurate, up-to-the-second portrayals of threats. They’re not useful for analysis or incident response (though some of the data collected might be). They’re meant to look impressive. They’re there to dazzle visitors to the floor, and to give some general sense of what’s going on at the perimeter: a gut-feeling activity gauge that’s slightly more amusing than a bar chart. So if we miss a few hundred events here and there, no harm done.
We’ve got the data, now what?
Now, we have to read the data in via the JavaScript used in the iPew project.
I started by finding the code in index.html responsible for plotting the source and
destination IPs on the map. This wasn’t too hard. There are several var lines dealing
with this:
var srclat = slatlong[src].lat;
var srclong = slatlong[src].long;
…and so forth. It seems the code is using srclat, sclong, etc. to store the values
that’ll be plotted. I can work with that.
So, knowing no JavaScript, I looked around for an example of reading in data from a file. Luckily, there’s an example in index.html itself:
d3.csv('samplatlong.csv", function(data) {slatlong = data;});
I adapted this to read in the data I was putting in a file every minute:
d3.csv('data.csv', function(data) {slatlong = data});
and then, I set up a loop to loop through each line:
if (slatlong.length !== 0) {
  cur = slatlong.shift();
This allows me to refer to each element in the line by the field names I gave in the header of the data file.
So, for example, I can assign the variable srclat by referring to the field name and variable: srclat=cur.slat
(where slat is the field name I used for the source IP latitude).
Done?
Once I could grab data from the SIEM, and ingest it into the JavaScript being used by iPew, the rest was a relatively easy effort in code cleanup, presentation preference, etc. I had to introduce a delay at the end where the original code looped, to account for times when the code reads in a new data file.
I also looked up some quick JavaScript to get the current date and time in a readable format, and found a container to display it in, along with data from another ArcSight query I set up to get the contents of a particular channel and parse them by severity level, so I could have a quick way to glance at the map and see how many important events are in that channel.
I also wrote a script that’d run some quick stats on the current data to get the count and top threat by country code. I did it in Python, only because I couldn’t figure out a good way to do it in JavaScript, and I was spending more time researching how to do it in JavaScript than it would take me to implement it in Python and have the JavaScript read the result.
Like I said, there wasn’t too much to worry about here, efficiency-wise, so if I wasted CPU cycles reading in another couple of numbers every minute, I wasn’t too concerned.